Last update: 12 March 2023
Number of people injured: 126,143
Number of deaths: 51,043
Number of people evacuated: 753,411
Number of buildings damaged or destroyed: 195,433

Kahramanmaraş earthquake
An analysis of the magnitude 7.8 and 7.6 earthquakes that hit Türkiye and Syria on 6th February 2023 and subsequent 6.4 earthquake in Hatay on 20th February.
Introduction
Last updated: 12 March 2023
On 6 February 2023 at 4:17 local time, a magnitude 7.8 earthquake (GLIDE number EQ-2022-000366-TUR) hit the region of Kahramanmaras in southeastern Türkiye, affecting areas of southern Türkiye and northwestern Syria. At 13:45 the same day, a 7.6 earthquake hit the same region. On 20th February a magnitude 6.4 struck in Hatay. This ongoing analysis, focusing primarily on Türkiye monitors the key figures published by the Türkiye authorities, examines the population and infrastructure exposure and impact, and monitors current information on displacement.
For more details, contact Bruce Spires bspires@iom.int or Brian Mc Donald bmcdonald@iom.int
Key figures
Sources: AFAD/OCHA
Exposure
The following map shows the areas affected by MMI 8,7 and 6, and the pre-crisis population of each exposed area.
View in full screen
| MMI | Türkiye | Syrian Arab Republic | |
|---|---|---|---|
| 8 | 1,544,067 | - | 1,544,067 |
| 7 | 3,414,675 | 35,876 | 3,450,551 |
| 6 | 9,462,076 | 2,357,980 | 11,820,056 |
| 14,420,818 | 2,393,856 | 16,814,674 |
Data sources: Worldpop, EC-JRC/USGS
Impacts
Damaged & destroyed buildings
There are two main sources for building damaged and destroyed buildings; AFAD official sources which are aggregated at the national-level; and buildings tagged as destroyed in OpenStreetMap, through the ongoing voluntary efforts, using available satellite and drone imagery. While tagging of destroyed buildings in OSM is ongoing, the completeness of the tagging will vary between areas. This dataset will be updated frequently to incorporate the additional data. Progress of the tagging, can be found on the OSM website.
As of 12 March 2023, 3,738 buildings have been identified from OSM as destroyed, 3,693 of which are in Türkiye.
Data sources: Openstreemap
Last updated: 12 March 2023
View in full screen
The following table contains government source building damage per district.
Sources: Türkiye Ministry of Environment, Urbanization and Climate Change
Last updated: 19 February 2023 (most recent report as of 27 February)
| Adana | Adiyaman | Diyarbarkir | Elazig | Gaziantep | Kahranmanmaras | Malatya | Hatay | Kilis | Osmaniye | Sanliurfa | TOTAL | |
|---|---|---|---|---|---|---|---|---|---|---|---|---|
| Heavily damaged units | 1,715 | 44,817 | 8,284 | 5,193 | 36,620 | 84,059 | 62,547 | 123,349 | 1,921 | 12,505 | 3,535 | 384,545 |
| Heavily damaged buildings | 97 | 13,730 | 1,110 | 1,036 | 15,008 | 22,113 | 16,870 | 30,112 | 1,261 | 3,794 | 663 | 105,794 |
| Moderately damaged units | 10,667 | 17,489 | 12,106 | 1,027 | 22,829 | 12,975 | 12,098 | 33,351 | 1,629 | 3,472 | 5,932 | 133,575 |
| Moderately damaged buildings | 462 | 4,338 | 1,044 | 174 | 5,662 | 2,208 | 1,694 | 7,281 | 307 | 465 | 829 | 24,464 |
| Slightly damaged units | 53,986 | 63,737 | 109,784 | 21,911 | 252,089 | 139,406 | 88,763 | 117,588 | 2,444 | 54,959 | 165,453 | 1,070,120 |
| Slightly damaged buildings | 2,568 | 19,410 | 10,977 | 2,176 | 42,945 | 33,664 | 17,745 | 366,112 | 4,746 | 11,830 | 22,913 | 535,086 |
| Undamaged units | 113,890 | 40,037 | 226,953 | 15,401 | 461,926 | 98,242 | 54,180 | 169,711 | 25,301 | 80,097 | 123,916 | 1,409,654 |
| Undamaged buildings | 9,396 | 18,598 | 27,334 | 1,266 | 135,809 | 45,395 | 17,333 | 77,107 | 7,918 | 36,666 | 30,964 | 407,786 |
| Damaged units TOTAL | 183,448 | 190,693 | 373,947 | 44,536 | 842,811 | 374,218 | 257,762 | 465,813 | 5,529 | 158,241 | 327,130 | 3,224,128 |
| Damaged buildings TOTAL | 13,141 | 63,452 | 45,149 | 4,810 | 228,272 | 117,801 | 64,883 | 158,112 | 15,387 | 56,371 | 63,428 | 830,806 |
Electrical infrastructure
According to to a report by UNOSAT:
Provinces with major light loss are Hatay, Kahramanmaras and Adiyaman as observed on 8 February 2023;
The power outage areas are mainly distributed along the plate junction of Kahramanmaras and Antakya;
Many urban areas located in EQ affected areas became darker after the earthquake;
Night-time light declined by more than 90 percent in many sectors of Hatay City as observed on 8 February 2023;
In Adiyaman, east sectors of the city lost more light than the west sectors;
Downtown Antakya (areas with higher light density) lost significant light after the earthquake compared to the suburbs.
Andiyaman
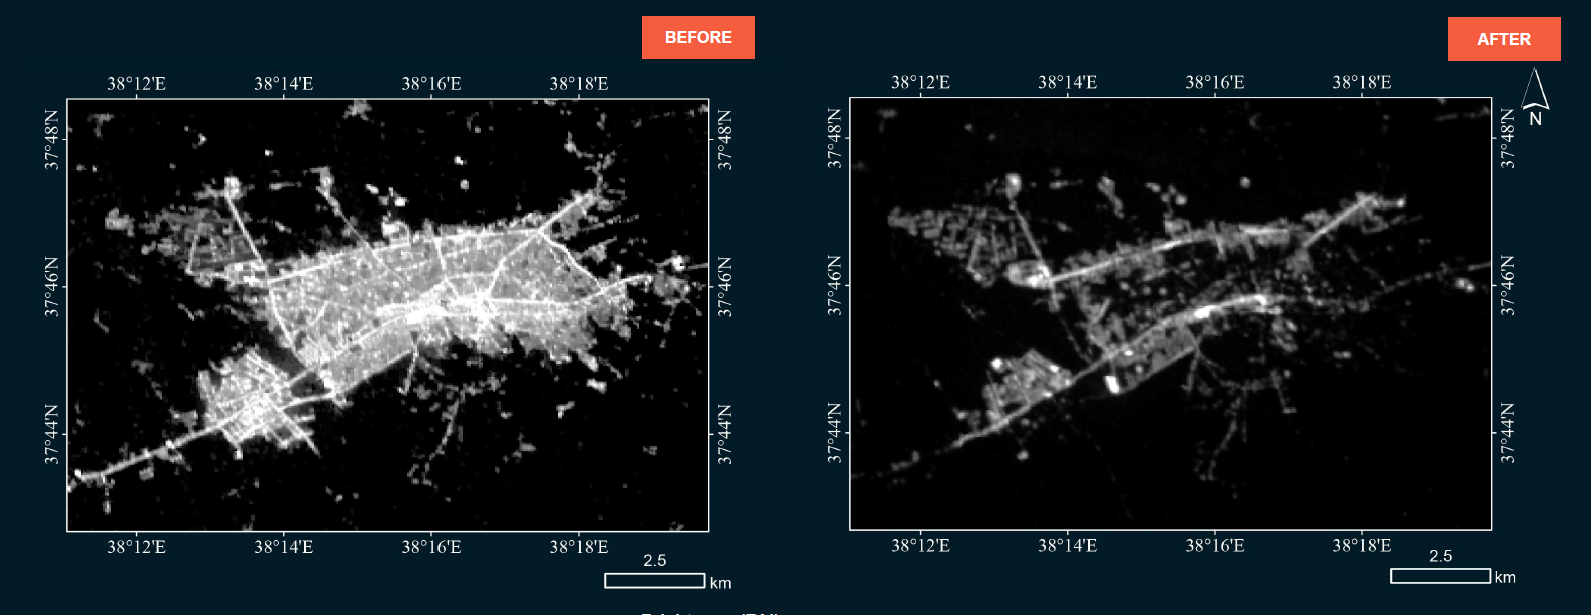
Source: UNOSAT/Wuhan University
Connectivity
in progress…
Displacement
Mobility trends
Data Source: Meta
City-level
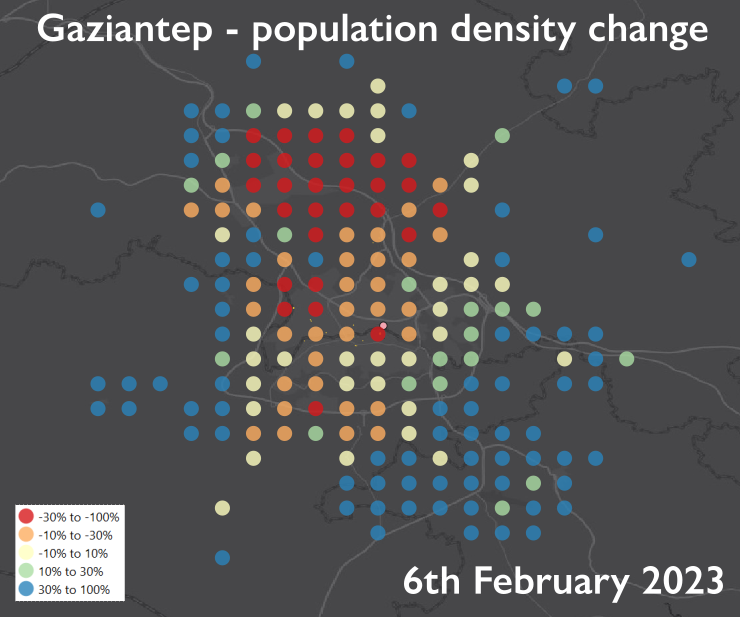
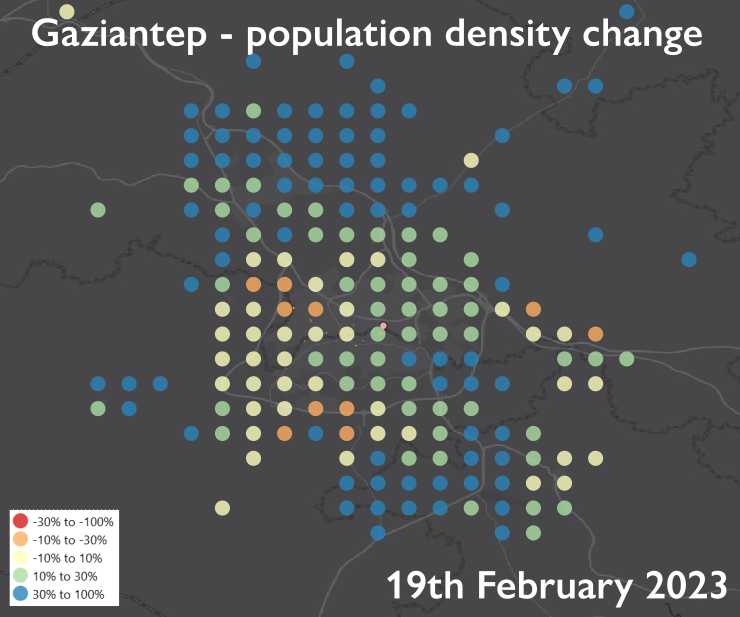
Gaziantep
The following images show the changes in population density(compared to a 90-day pre-crisis baseline) for areas within metropolitan Gaziantep at 16:00 on the 6th and 19th of February. The image from 6th February shows a sharp decrease in population in city-centre areas and a sharp increase in suburban areas. The 19th February image shows a relative normal city centre population but a continued increased density in suburban areas.
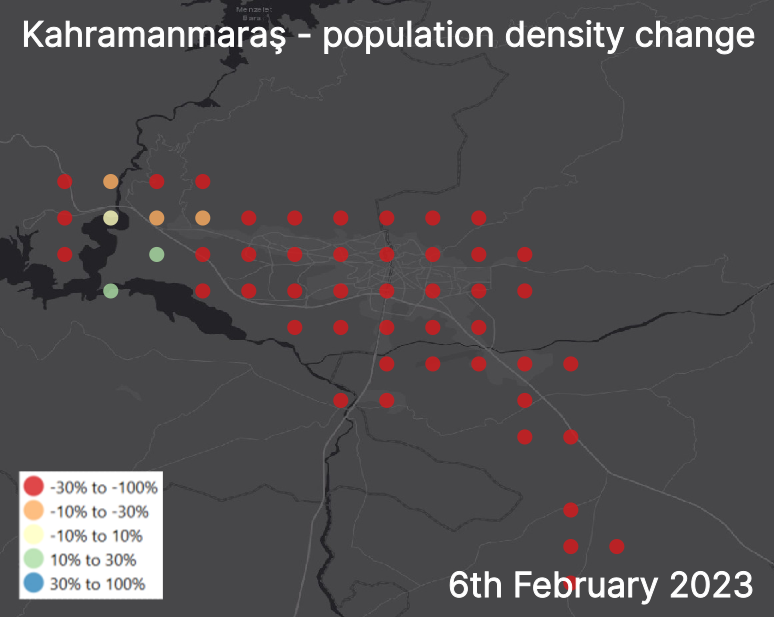
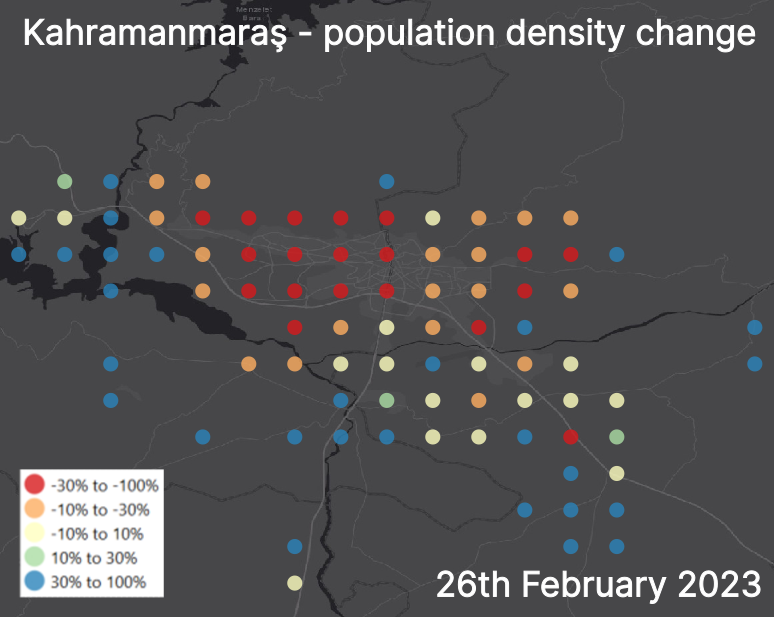
Kahramanmaraş
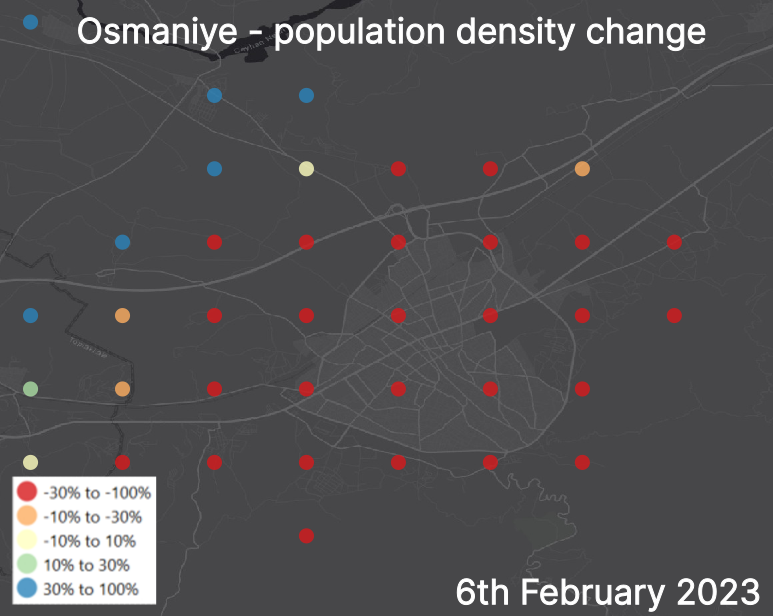
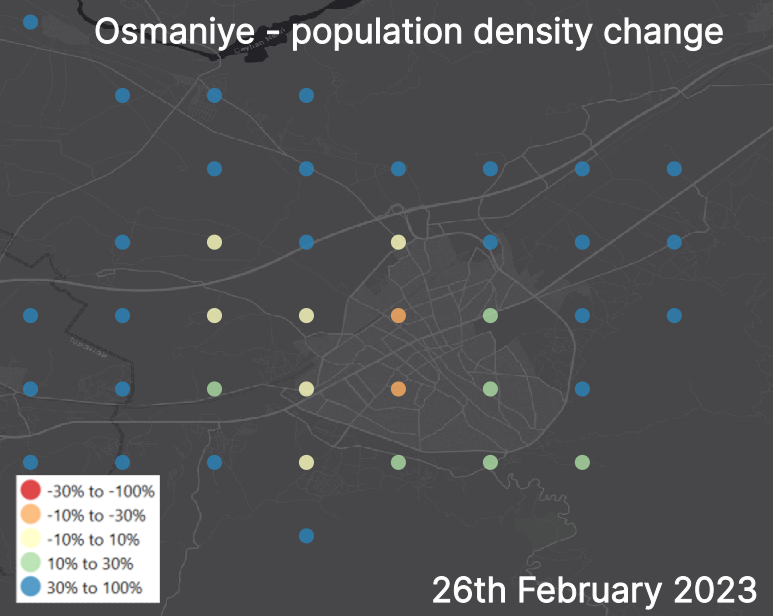
Osmaniye
For Osmaniye the 6th of February seen a sharp decrease in population across the entire city, with increases on it’s western suburbs. By 26th February the populatiion density of the city is close to returning to its pre-crisis baseline, while all surrounding suburb show significant increase over the baseline.
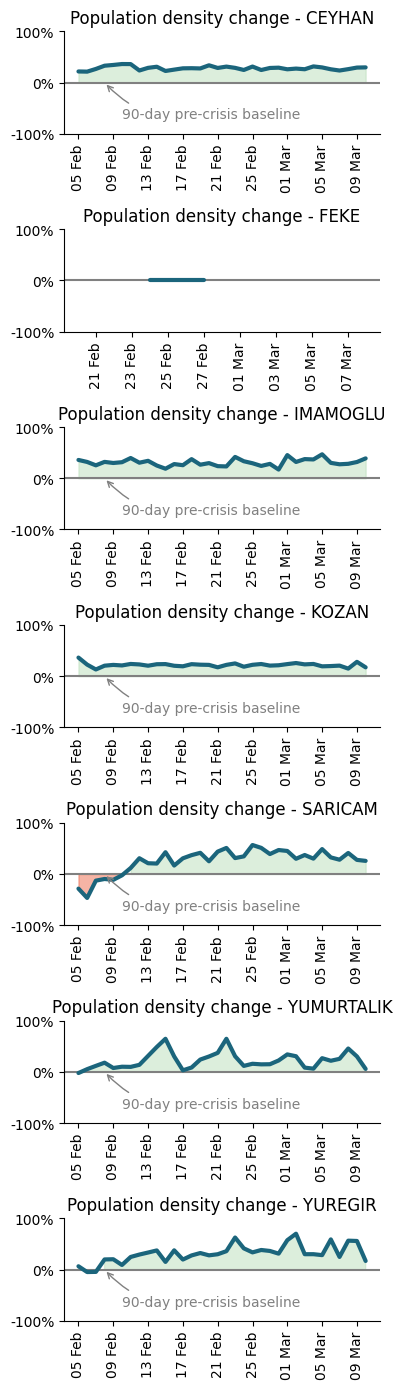
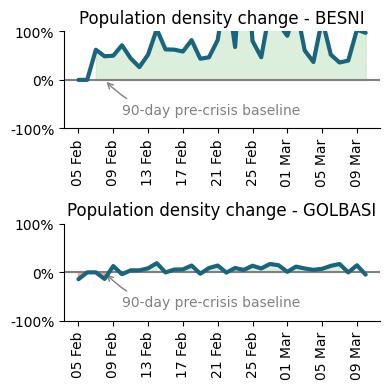
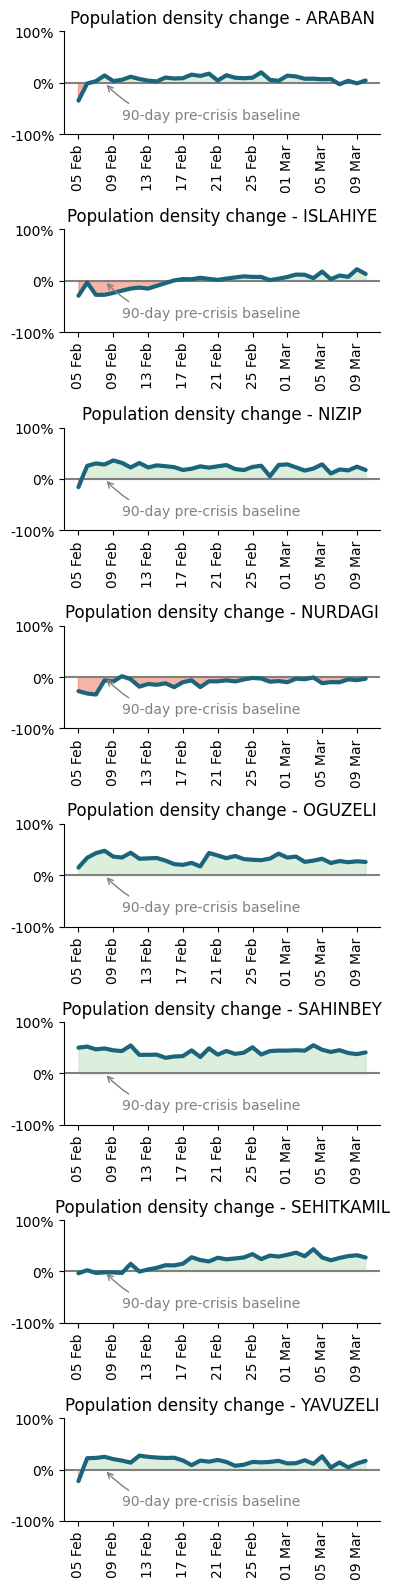
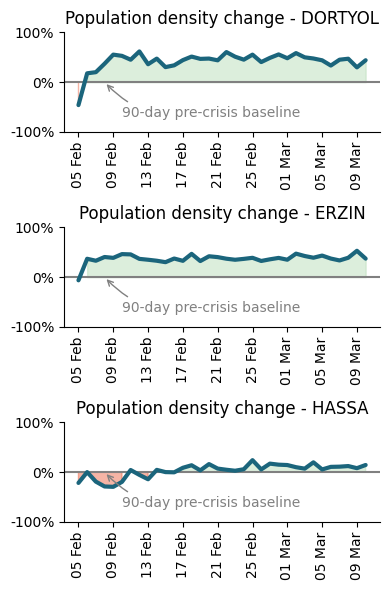
District-level
Adana
Adiyaman
Gaziantep
Hatay
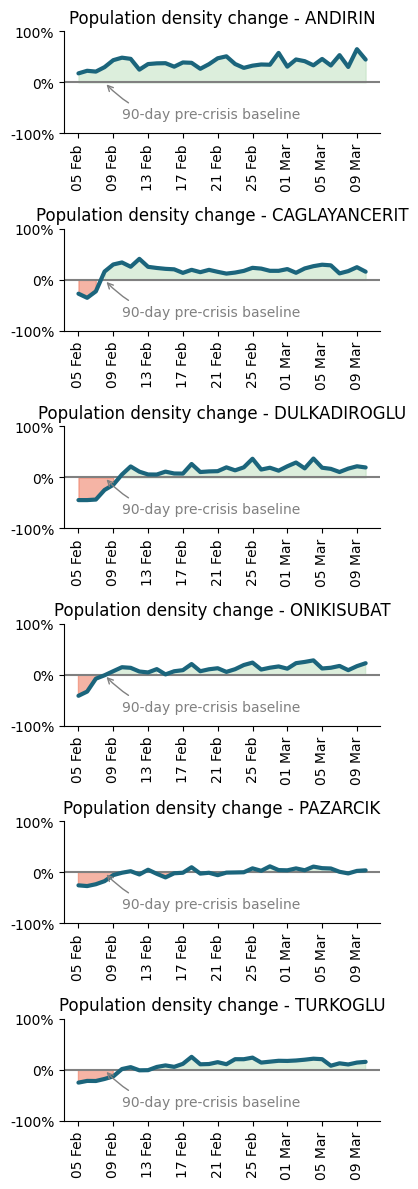
Kahramanmaras
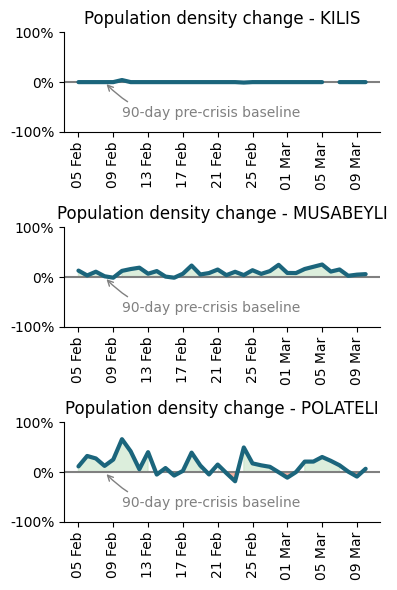
Kilis
Site-level
in progress…
Services
Source: afetbilgi.com
Last updated: 2023-03-12
The following map shows accomodation centres (orange), evacuation centres (green), and gathering points (blue)
Vulnerability
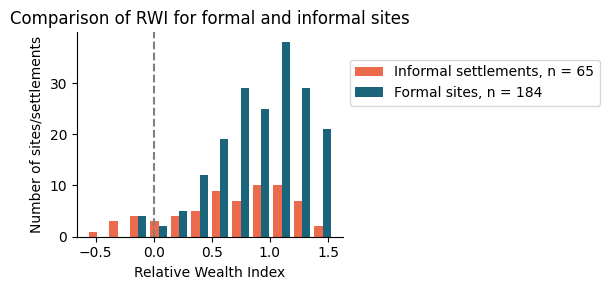
Sources: IOM’s DTM & Meta - Relative Wealth Index
Updated: 8 March 2023
Despite there being far less Informal Settlements , their distribution clearly shows that Informal Settlements have a higher tendency to be in areas with a much lower Relative Wealth Index than than Formal settlements. Overall, approximately 5% of settlements are in locations with a negative RWI (lower than average), 14% of Informal Settlements, 2% of Formal Settlements.